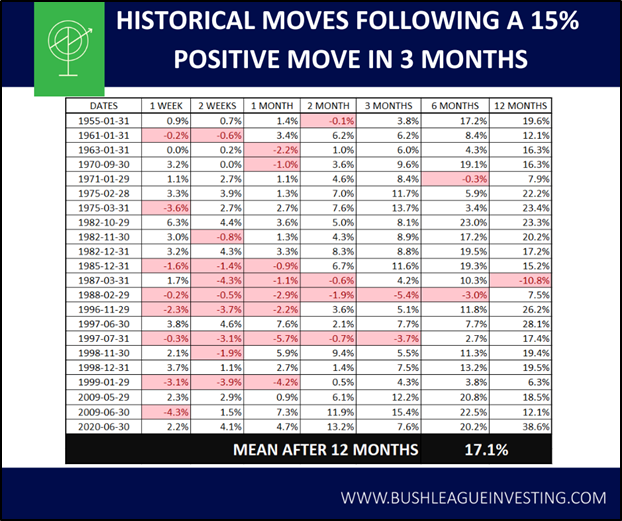
The S&P 500 has been on an absolute tear for the last 3 months. Investors are feeling both extreme FOMO and that we have stretched too far and the market is about to correct. Both interpretations are valid so to stop ourselves from making long-term decisions based on emotion, it is best to look at what has happened in the past after an epic rally like this.
As it turns out, the market has had a run like this 22 times since the 1950’s and 21 times ended up higher 12 months later. This is not surprising as the market normally goes up, but it’s important to note that even after big moves there are always more opportunities. Investors who completely sell off after big moves or who give up thinking they have missed out are destined to watch it keep going higher 95% of the time.
This doesn’t mean it can’t be down 12 months from now, just that the odds favour a continued push up.
I will continue to be invested and wait until the charts, fundamentals or macro screams it is time to get out.
There are many ways to decide whether or not your investments are doing well. The goal most people are shooting for is a decent return without taking on unnecessary risk. With this in mind, you can measure your return against almost anything understanding that a good return and unnecessary risk mean different things to different investors.
Since I have a long-term investing horizon and am comfortable with what I consider medium risk, the S&P 500 is a great benchmark for me to measure my return against. Supposing I was unable to beat this benchmark, it would be super easy to just buy an ETF that tracks the S&P 500 and save myself a massive amount of time and energy. This is what I think is best for people with no time or interest to self-manage their investing. But for those of you with time to dedicate to managing your own portfolios, I encourage you to consider the S&P 500 as a key measuring stick to track the growth of your own return.
What is the S&P 500?
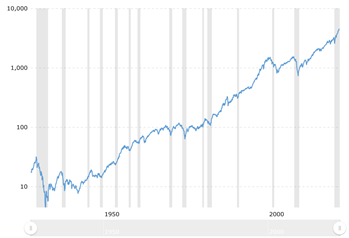
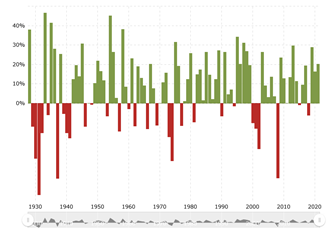
The S&P 500 is a market cap weighted index featuring the 500 largest companies that meet all of the inclusion criteria. The number of holdings changes when current companies issue multiple share classes or there are companies excluded/included to the index. It has returned approx. 10% annually and much higher in the last 10 years. Looking at the below charts showing the index’s history since 1930 it’s hard to imagine losing money just buying this index, but there have been a few rough patches with multi-year losing streaks.
Source: Macrotrends.net
Can you beat it?
Yes
Should you try?
Maybe (if you’re willing to put in the work)
Have I been beating it?
I thought you’d never ask.
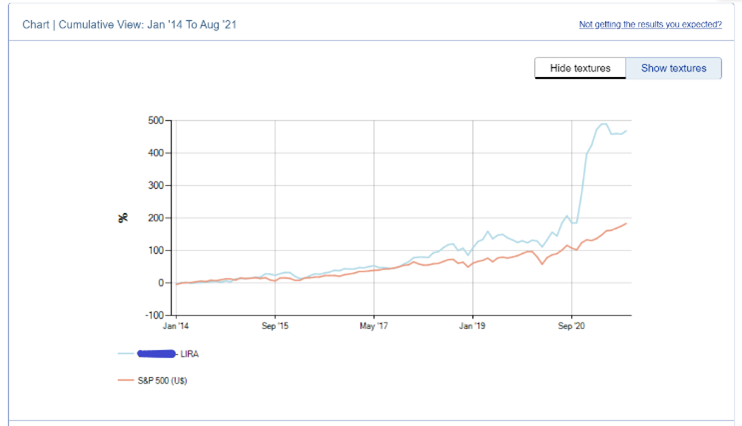
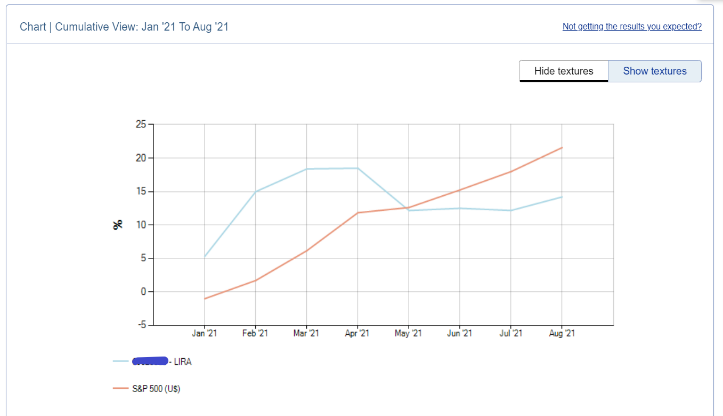
Since 2014, the investing account shown below (LIRA – Locked In Retirement Account, Canada) is up 470% compared to the 185% of the S&P 500. I am unable to add or withdraw money from the LIRA, so it’s an accurate view of my actual investing results to date. For the first few years we were beating it, but it was close. Last year, we destroyed the S&P 500. So far this year, I started out ahead and over the last few months the S&P has outpaced me.
Will we always beat the S&P 500?
As recent months have shown, there will be stretches where the index outperforms Bush League; however, I am confident that over any multi-year period the correct move for me will be to continue to manage my own investing.
The case for managing your own investments
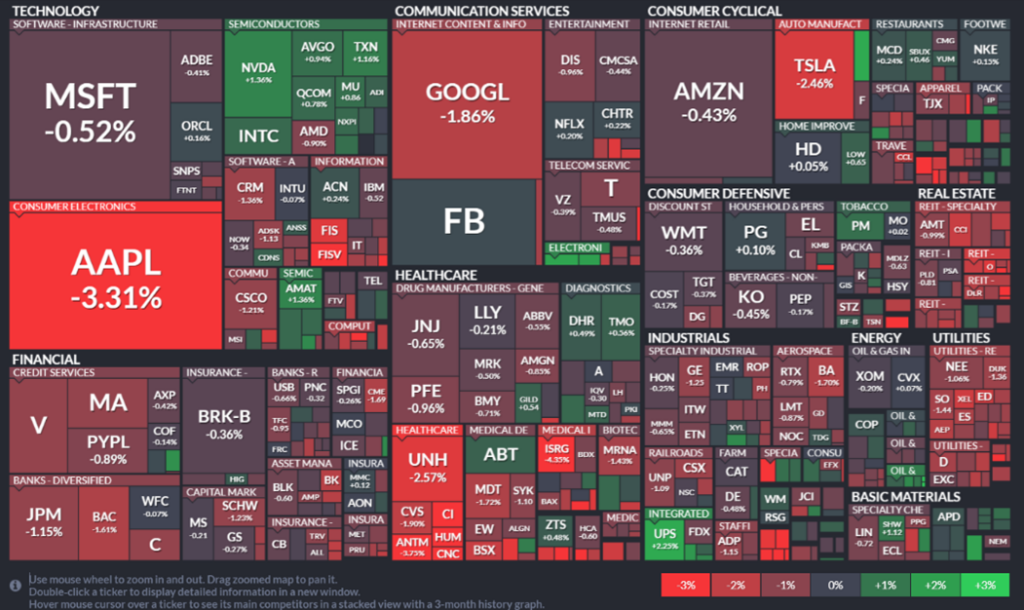
I like the ability to profit when the market goes down (it does sometimes), and I like the ability to allocate more capital to ideas I think will do better than the average or that I personally think benefit society. The S&P 500 is market cap weighted which means bigger companies have a bigger effect on the direction it moves leading to a small handful that steer the index (ie. FAANG+M). The perception of owning an index of 500 companies is that there is good diversification, but in my opinion there is much less than most people realize. The below image shows that when big tech has a rough day, the entire index follows.
Heatmap S&P 500 image from finwiz.com
So why compare?
Constantly keeping score against this index allows me to see what is working and what is not in my own portfolio. The S&P 500 is known as the “market”; if people say “the market” is up or down, they are usually referring to this index. If the market has been ripping for years and you are not making any money, comparing your results allows you to evaluate whether you are seeing things as they are or as you think they should be. If I had been stuck watching P/E ratios and complaining that everything was overvalued for the last 7 years, I would have missed what was happening in the market.
My assessment is that my portfolio will continue over long periods of time to beat the S&P 500. When it goes up my portfolio seems to do well and when it crashes, we are hedged so we stand to do very well. In the event I find the way I invest isn’t working compared to the S&P 500 then I will either adjust or buy the index and get a different hobby.
How does your portfolio’s results compare to the S&P 500?
We use cookies to ensure that we give you the best experience on our website. If you continue to use this site we will assume that you are happy with it.Ok